
MOMA EXHIBITION HISTORY: THROUGH GENDERED LENS
My final Information Visualization lab report utilized MoMA’s exhibition history data enriched with Wikidata data to understand how the network of co-exhibited artists compared to each other if broken down into male and female artists. It is worth noting gender beyond the binary was rarely captured and its absence speaks to the need to have that representation highlighted.
I was fortunate to work with Jonathan Lill, Head of Metadata and Systems of the Museum of Modern Art Archives, Library, and Research Collections, who played a major role in originally curating the dataset. I had direct access to the latest iteration of the data set (not currently posted on MoMA’s Github repository). Great time was dedicated to cleaning the data in OpenRefine and leveraging its reconciliation service through Wikidata paired with JSON to to enrich the original data’s lacking gender fields. Additional gender values were populated via Wikidata person entity records with named authority identifiers such as ULAN and VIAF. The data sets were separated into either male or female co-exhibiting artists then processed through Python to create the nodes (exhibitions) and edges (two artists co-exhibiting for a set of nodes) list.
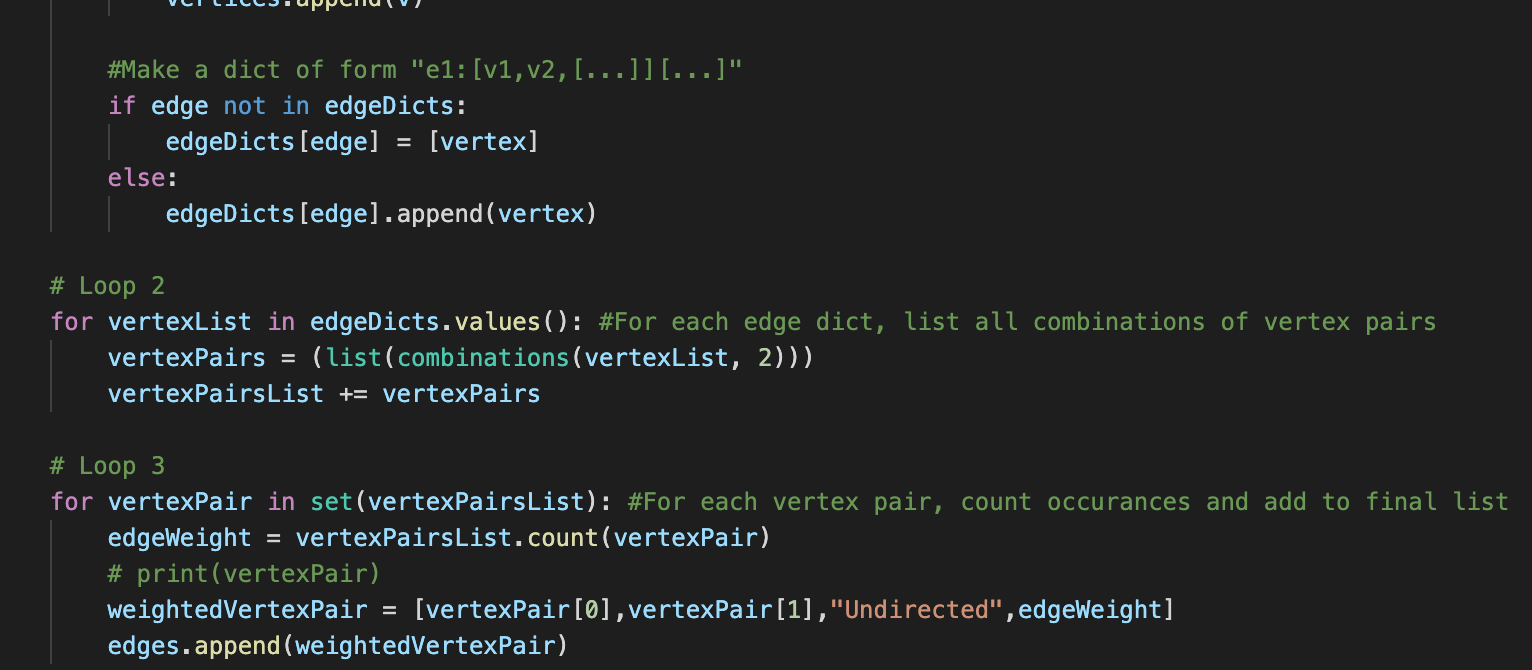
Portion of the Python script used to prepare data for Gephi

Open Refine's reconciliation service
Network graphs were compiled in Gephi where statistical analysis and algorithmic parameters were performed to yield a spatially sound layout. I conducted user experience (UX) research to gather feedback on the visual presentation, interactivity elements, and data’s intelligibility. Revisions on the visualizations and data were implemented based on the UX research. An interactive network graph through sigma.js was created to encourage self-lead exploration of the data.

Screenshot of the MoMA Exhibitions - Female Artists network graph in sigma.js
The data analysis and subsequent visualization I produced on this final lab resulted in a proficient selection and utilization of an open source digital tool set: Gephi, OpenRefine, and Wikidata. The process I devised to realize this project is completely replicable. Other museums and cultural heritage institutions could leverage my process and the open source toolkit to run analysis and visualizations on their own exhibition histories. In performing this type of visualization, the viewers can gain a greater understanding of an institution collection’s gender diversity and receive a transparent view of their holdings and activities. I was encouraged to hear Jonathan Lill’s UX feedback specifically, which revealed to him new ways of displaying the data previously unrealized.